Introduction
According to the Global Report on Food Crises by the World Food Programme, in 2023, nearly 282 million people across 59 countries faced high levels of acute food insecurity. There is an urgent need for intervention, and to spend what funding is available as effectively as possible. Catholic Relief Services (CRS) uses machine learning and algorithms to predict food prices, enabling their programs to budget their needs more accurately and to procure food at the best possible prices.
Background
Aid for those impacted by food insecurity can be delivered through a number of different modalities. While in the past the main approach was to ship food from the Global North to those areas in need, approaches such as cash and voucher assistance (CVA) and local and regional procurement (LRP) are viable alternatives that can provide assistance when food is available in the affected country or region or local markets are functioning but suffer from lack of effective demand.
Across modalities, CRS country programs need to continually monitor markets to confirm the continued appropriateness of the modality/procurement strategy and to inform programmatic and operational decisions. In particular, programs need to make decisions on where and when to make food purchases, and how much cash is required to cover identified needs. These are not easy tasks as food prices can be impacted by many factors across local, regional, and global levels.
To support country programs in their decision making, the CRS data analytics unit teamed up with the agency’s market monitoring specialists to develop a machine learning model for forecasting food prices at national and local levels.

AI development
Previously, CRS country programs were using manual processes and spreadsheets to support their decision-making on CVA and LRP. However, this is complex due to the many different sources of data involved. It also has limitations in terms of forecasting functionality and the ability to manage large amounts of data. What they wanted was a One-Stop Data Shop that would provide them with the information they needed, in an easily accessible format.
To achieve this, the team needed to explore which data to use and how to use it, how to deal with the impact of seasonality on food prices, and which machine learning models would provide the best accuracy working on more than 15 years of historical data. They also had to figure out what would be an acceptable confidence interval to help country programs determine where they need to build in appropriate price volatility buffers into their budgets. For some food commodities, the team found that the prices were too variable to create reliable forecasts – in response, they created another algorithm to identify commodities with high price volatility.
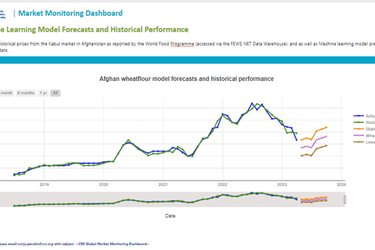
The result was Market Monitoring Dashboards that combine global data from sources such as the World Bank and the World Food Programme with information collected locally by program teams to provide insights relevant to the local context, and to calculate 6-to-12-month price forecasts that have a high level of confidence.
Operationalising AI
The team has to date developed a global Market Monitoring Dashboard, as well as regional and country-level dashboards. Apart from identifying and collecting local market data on food prices, a crucial part of implementing the dashboards is to ensure their users understand how to use them for decision making. Collaboration is key for this: the Dashboards are designed and developed as a collaboration between technical and subject matter experts, leading to strong ownership by the users of the Dashboards while data analysts provide technical backstopping.
Feedback from users is positive: the Dashboards save time versus their earlier, spreadsheet-based calculations, and give credibility to the numbers presented.
The Dashboards also enable better business development. They provide improved insights for building budgets for food security grants as well as highlight risk areas where accurate forecasts are not possible.
Working out more accurate measures of success has proven to be challenging; CRS would like to calculate savings made when procuring food based on the tool’s forecasts – however this would require substantial input from the country program teams who are already stretched and understandably prioritise their support to the local communities.

Another challenge the team has faced relates to infrastructure capacity. The team is currently working on improving the performance of the machine learning models so the Dashboards can be rolled out to more countries.
Learnings
Development of the Market Monitoring Dashboards has been a journey over a couple of years, during which the team has learnt a number of lessons.
Sustainability: The Dashboards are not a one-off investment, but require ongoing updates, maintenance and funds to cover software and (potential) data costs. Sustainability of funding can be advanced by outlining the cost of maintaining the Dashboards and building these into grant budgets moving forward.
Ownership: Ensuring that the program teams using the Dashboards have strong ownership and capacity to use them effectively is central to the Dashboards adding value. This can be achieved through co-design, trainings, and the development of guidance. Program ownership of Dashboards also reduces dependency on technical experts, allowing them to scale the approach to additional contexts.
Collaboration: The strong partnership between the CRS Market Monitoring specialists and its data analytics team was crucial to ensure the Dashboards meet the needs of program staff, are theoretically accurate, and are also technically sound and scalable. Key to success was combining a clear vision of the programmatic need and the added value the Dashboards could provide, with technical ability to create them.
Standardisation with customisation: Building a suite of standard/template dashboards that are geared toward common market monitoring objectives (e.g., cash transfer values, local procurement, market development) allow Country Programs to more easily and rapidly customise dashboards to meet their specific needs.
Plans for the future
Scaling the Dashboards to additional regions and country programs remains a priority of the team. They also continue to finesse the approach, both in terms of improving the performance of the machine learning models, addressing infrastructural bottlenecks, and exploring how additional analytics could provide further insights. The team is also adjusting to the new operating environment, including exploring what data sources are available and how sector-wide collaboration on using data to address food insecurity can lead to increased impact.
Where to learn more
- Nora Lindstrom, Senior Director of ICT4D, CRS, nora.lindstrom@crs.org
- Megan McGlinchy, Market-based Supply Chains Team Lead, CRS, megan.mcglinchy@crs.org
- www.crs.or
